
Wind atlas
Our temporally and spatially high resolved time series of the fundamental meteorological parameters as well as various derived products assist you with cost-effectively answering questions in all phases of planning and operating your wind farm.
Our wind atlases are based on temporally and spatially coarse resolved reanalysis data (e.g. ERA5, MERRA2 or NCEP). Additionally, detailed information of land use and orography are used in the model simulation. High resolved time series for a time period of more than 20 years are derived by downscaling the coarse reanalysis data with the mesoscale models WRF or MM5.
The quality of the wind atlases is continuously being verified by validation with wind and energy yield data. Based on this verification, a remodeling approach for the 3 km wind atlases for Germany and France and the 1 km wind atlas for Germany was invented in order to adapt the wind atlas universally applicable to observational data.
By means of the remodelling and the adjustment of the time series, we are able to generate site-specific time series. Thereof, all our products based on the atlas benefit, e.g.: wind and energy yield index, long-term correlation, energy loss calculation and market value analysis.
Further information about the remodelling is available here.
Overview of our anemos Wind atlases
| Atlas name | Region | Documentation | Reanalysis | Resolution | Remodelling | Time period | Model |
|---|---|---|---|---|---|---|---|
| D-1km.E5 | Germany | D-1km.E5 site specific (in German) | ERA5 | , 1.35 km / 10 min | yes | 1999 - current | WRF |
| D-3km.E5 | Germany |
Flyer D-3km.E5
D-3km.E5 site specific (in German) |
ERA5 | , 3 km / 10 min | yes | 1997 - current | WRF |
| D-3km.M2 | Germany | D-3km.M2 site specific | MERRA-2 | , 3 km / 10 min | yes | 1997 - current | WRF |
| D-5km | Germany | NCEP | 5 km / 30 min | no | 1990 - 2025 | MM5 | |
| EU-10km.E5 | Europe | EU-10km.E5 | ERA5 | 10 km / 10 min | no | 1999 - current | WRF |
| EU-20km.M2 | Europe | MERRA-2 | 20 km / 10 min | no | 1990 - current | MM5 | |
| EU-90km | Europe | NCEP | 90 km / 3 h | no | 1948 - 2025 | MM5 | |
| F-3km.M2 | France, Belgium, Switzerland | F-3km.M2 site specific | MERRA-2 | , 3 km / 10 min | yes | 2007 - current | WRF |
| PL-1km | Poland | PL-1km | ERA5 | 1 km / 10 min | no | 1999 - 2025 | WRF |
| PL-3km | Poland | MERRA | 3 km / 10 min | no | 1995 - 2015 | WRF | |
| PL-5km | Poland | NCEP | 5 km / 10 min | no | 1990 - 2025 | MM5 | |
| SK-10km | Scandinavia / baltic states | SK-10km | ERA5 | 10 km / 10 min | no | 2000 - current | WRF |
Also, an overview of our most important wind atlases incl. their model grids is available via our atlas grid tool within awis.
Extreme value estimation
For your wind farm, we calculate the 50-years extreme wind speed based on site-specific time series from our Germany 3km wind atlas. The calculation procedure for the extreme wind speeds is based on the method of the program WindPRO. The applied gumbel adaption is based on the least squares method.
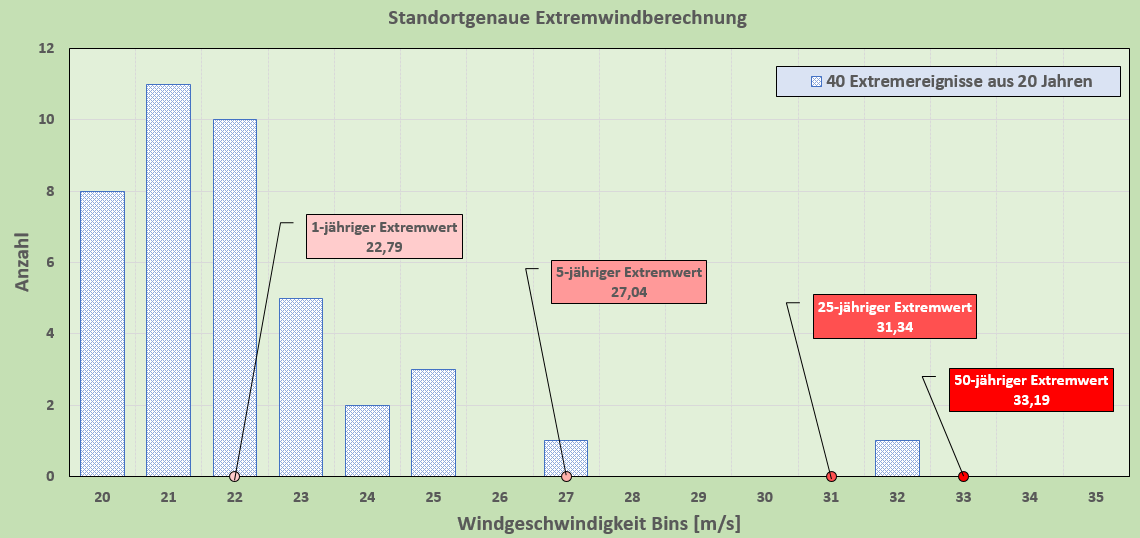
The calculation procedure includes the following steps:
- Calculation of site-specific wind speed time series (min. 20 years) at the desired hub height for the most conservative (highest wind speed) WTG.
- With 40 onshore measurements, a scale factor for extreme wind speeds will be calculated and applied to the time series.
- With a gumbel distribution the extreme value and standard deviation for 50 years will be calculated.
Initial estimation based on wind atlases
For an initial estimation based on the anemos wind atlases, our experts assess the wind conditions at your site* and, on request, the energy yield and possible losses. You receive a signed report.
The initial estimation assists you with the decision for the correct measurement location, can form the basis for turbulence calculations and allows you to compare different WTG types.
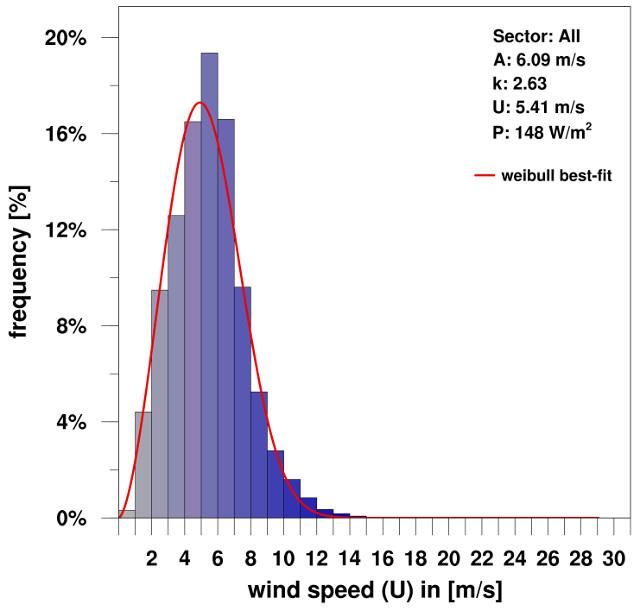
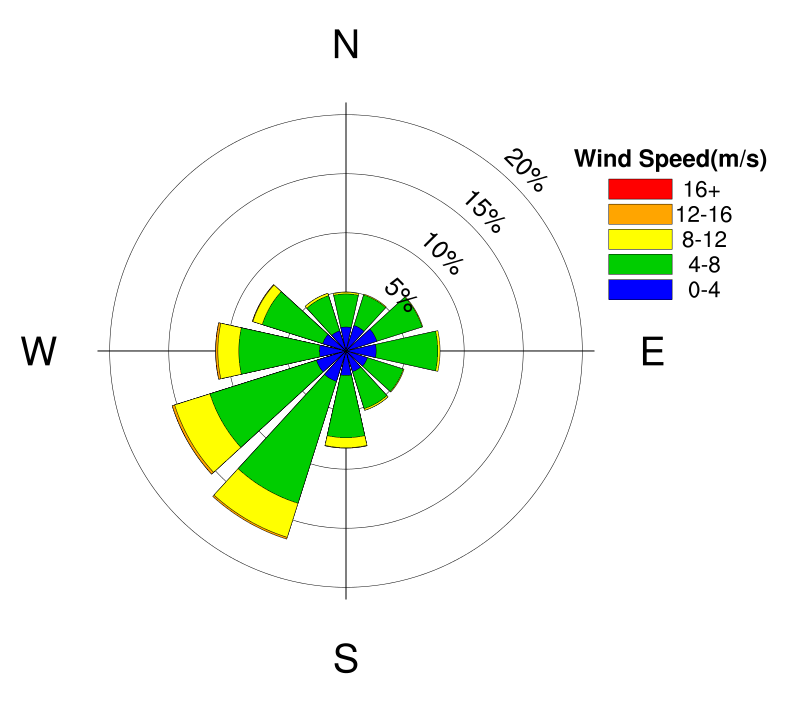
The initial estimation can contain:
- mean wind speed and optionally mean energy yield (20 years)
- frequency distribution of wind speed and wind direction
- directional Weibull distribution
- annual cycle of wind speed and optionally energy yield
- consideration of wake effects plus further losses
- .tab file for application in WAsP, WindPRO, Meteodyn, etc.
The results you need depend on your project. We agree the scope with you, from the wind statistics alone to an estimate of the energy yield including losses.
* site-specific estimation for Germany and France available; for other regions, the spatial resolution of the corresponding wind atlases applies
Estimated ambient turbulence
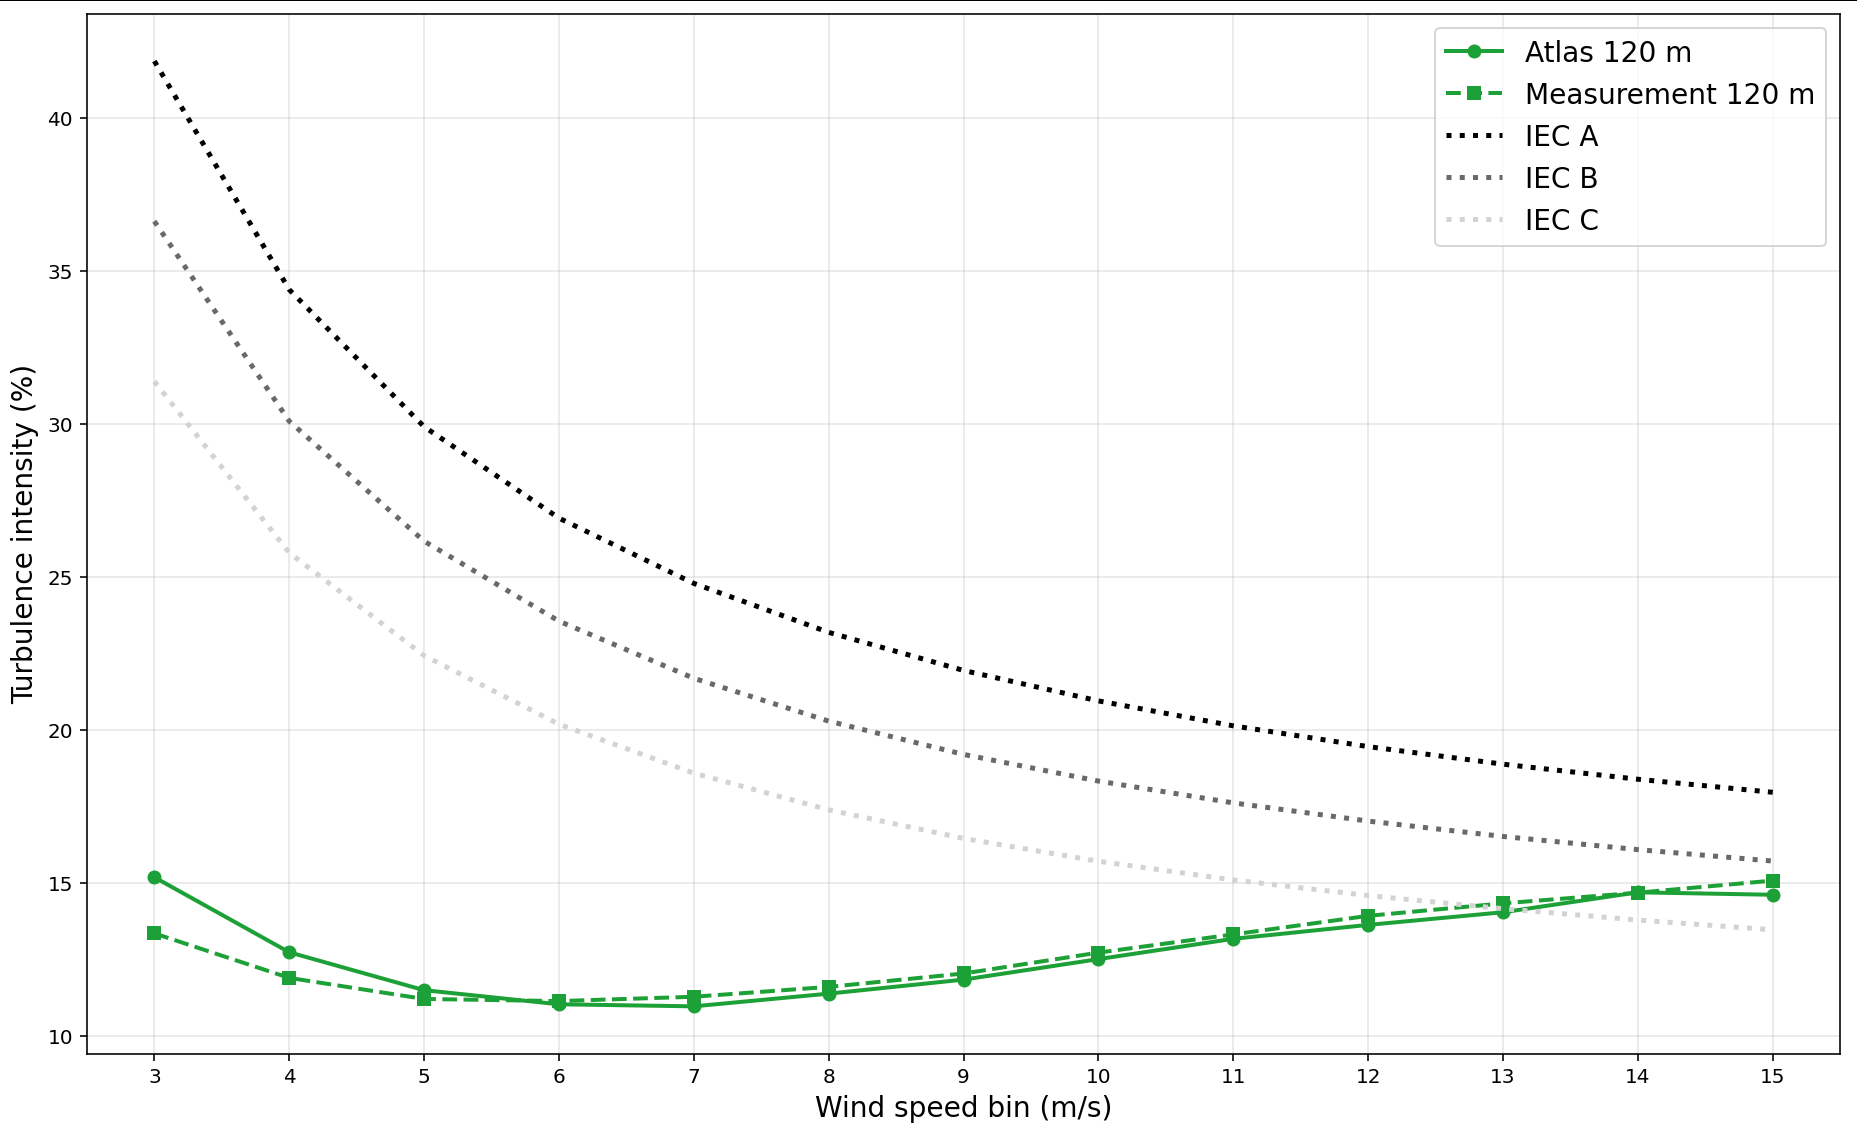
Turbulence intensity is an important parameter for the planning of wind turbines, as it influences site assessment and selection of the appropriate turbine class. We determine turbulence intensity based on data from the wind atlas. It is derived from the turbulent kinetic energy (TKE) calculated by the WRF model and reported on a sector-by-sector basis.
The sector-by-sector analysis enables a realistic assessment of site-specific flow conditions and provides a reliable basis for the planning and design of wind turbines. Through ongoing comparison with measurement data, we ensure the high quality and plausibility of the results.
Layout optimization
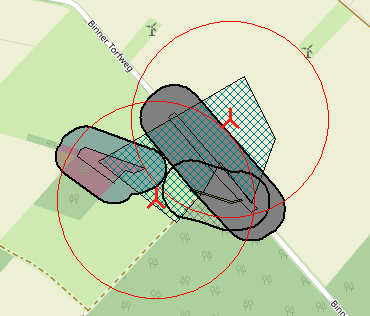
When planning a wind farm, the optimization of the layout, i.e. the arrangement of the individual wind turbines within a wind farm, is of crucial importance. A well designed layout maximizes the energy yield and minimizes the ecological impact. We accompany your project in the initial stages and are able to support you in planning a yield-optimized layout based on our site-specific wind atlas time series.
The following points are important:
- Spacing and placement: Optimal arrangement of the wind turbines to achieve the highest possible energy yield.
- Consideration of environmental factors: Minimizing the ecological impact by taking site conditions and legal requirements into account.
- Simulation and modeling: Precise analysis and modeling of different scenarios for the best result.
We can analyze the optimal use of the available space in a relatively short time and provide you with a recommendation for a layout. Several variants (different wind turbine types) can be compared with each other. An initial assessment of wake losses is also made. This maximizes yields while minimizing turbulence and loads.
Time series
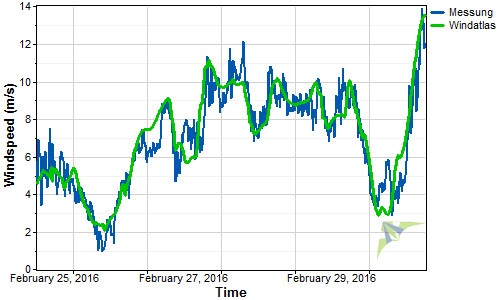
Our high resolved and site-specific* time series („Virtual Met Mast“) provide you with reliable information on the wind conditions at your site for a fraction of the costs of a wind measurement.
We offer time series for various parameters: wind speed*, wind direction, temperature, air pressure, humidity, air density, global irradiance and precipitation. The heights are freely selectable between 40 m and 300 m.
The time series are used in diverse areas of operation:
- initial estimation of the wind potential
- long-term correlation of an existing measurement for a reliable result
- input data for model simulations (WAsP und CFD)
- calculation of time-dependent losses (noise immission, bat flight, etc.)
The advantages of high resolved time series over global reanalysis data are variegated and are referred to in this article.
In addition, we offer time series that we scale and adjust for your site, as well as special analyses based on the time series. These services are not available in awis. Feel free to contact us about them.
* site-specific time series are available for the wind speed data of the atlases D-1km.E5, D-3km.E5, D-3km.M2 and F-3km.M2.
 This product is available in our webtool awis
awis wind potential
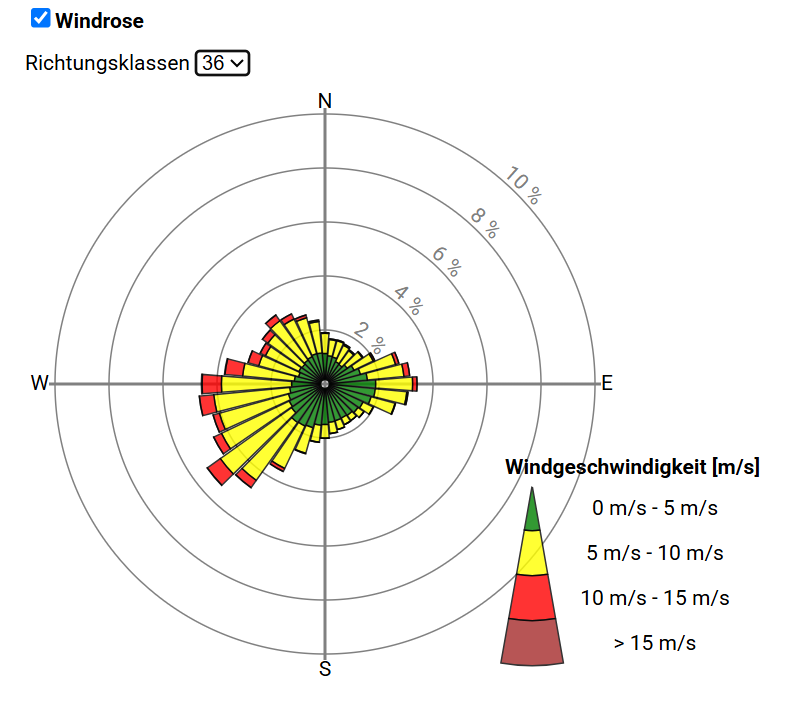
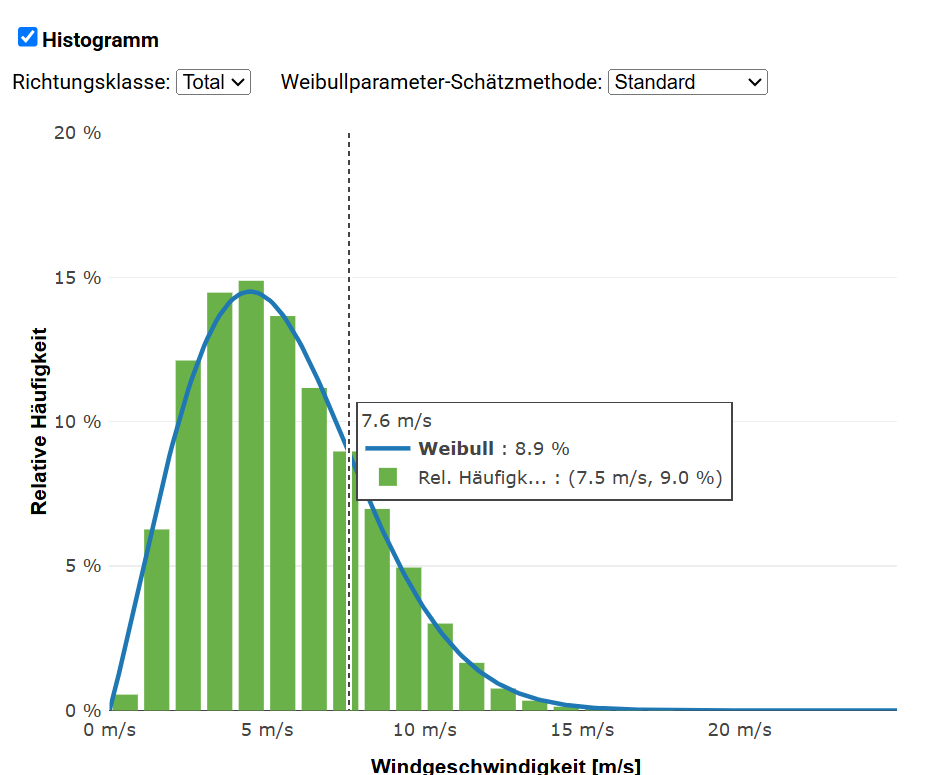
In our web tool awis, you can retrieve the wind statistics for your site directly online with the wind potential product: fast and cost-effective. The results are calculated automatically from the anemos wind atlases, without processing by an expert.
You receive:
- site-specific* wind speeds
- Weibull parameters A and k
- wind rose with 12 or 36 wind direction sectors
- frequency table of wind speed by wind direction sector
- histogram of wind speed
- Excel table with all values for download
- automatically generated PDF report for your site with all results
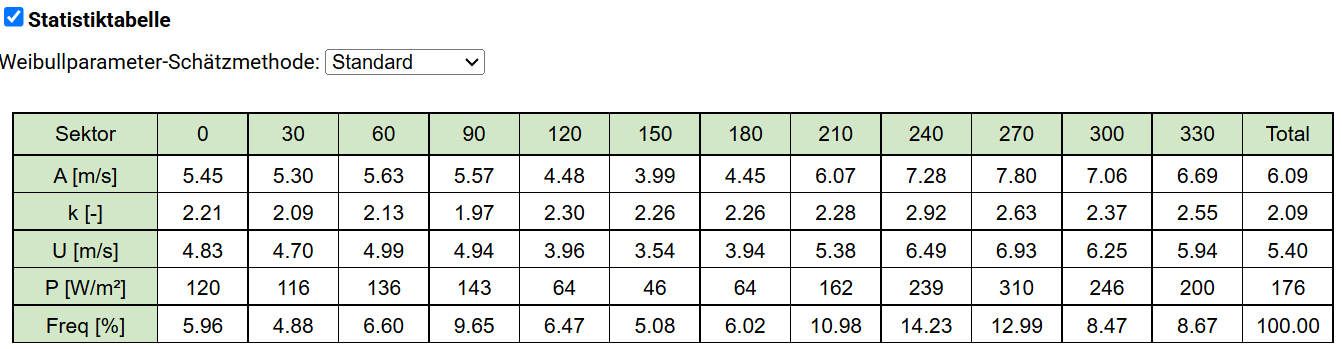
As an additional service, we also prepare the statistics with a temperature filter that only considers values below a certain temperature, e.g. for ice throw assessments.
Do you need an expert opinion, e.g. because our experts should take a closer look at the site or make adjustments, or a signed report? Then the initial estimation based on wind atlases is the right choice for you.
* site-specific for Germany and France; for other regions, the spatial resolution of the corresponding wind atlases applies
This product is available in our webtool awis
Energy yield index
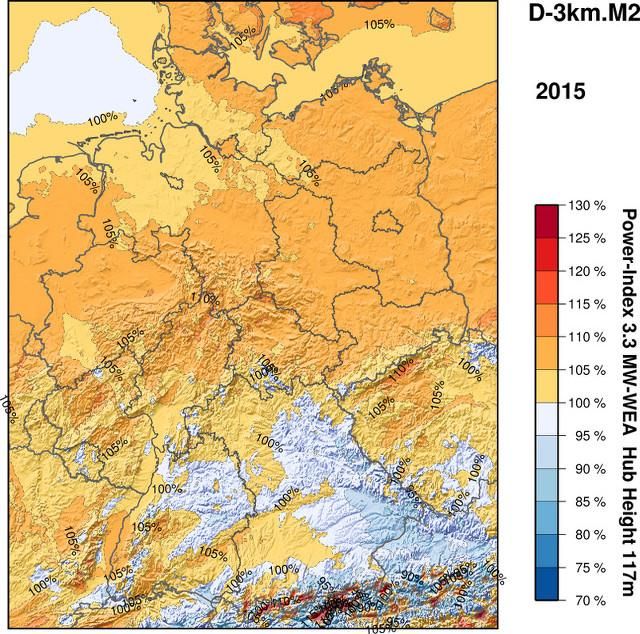
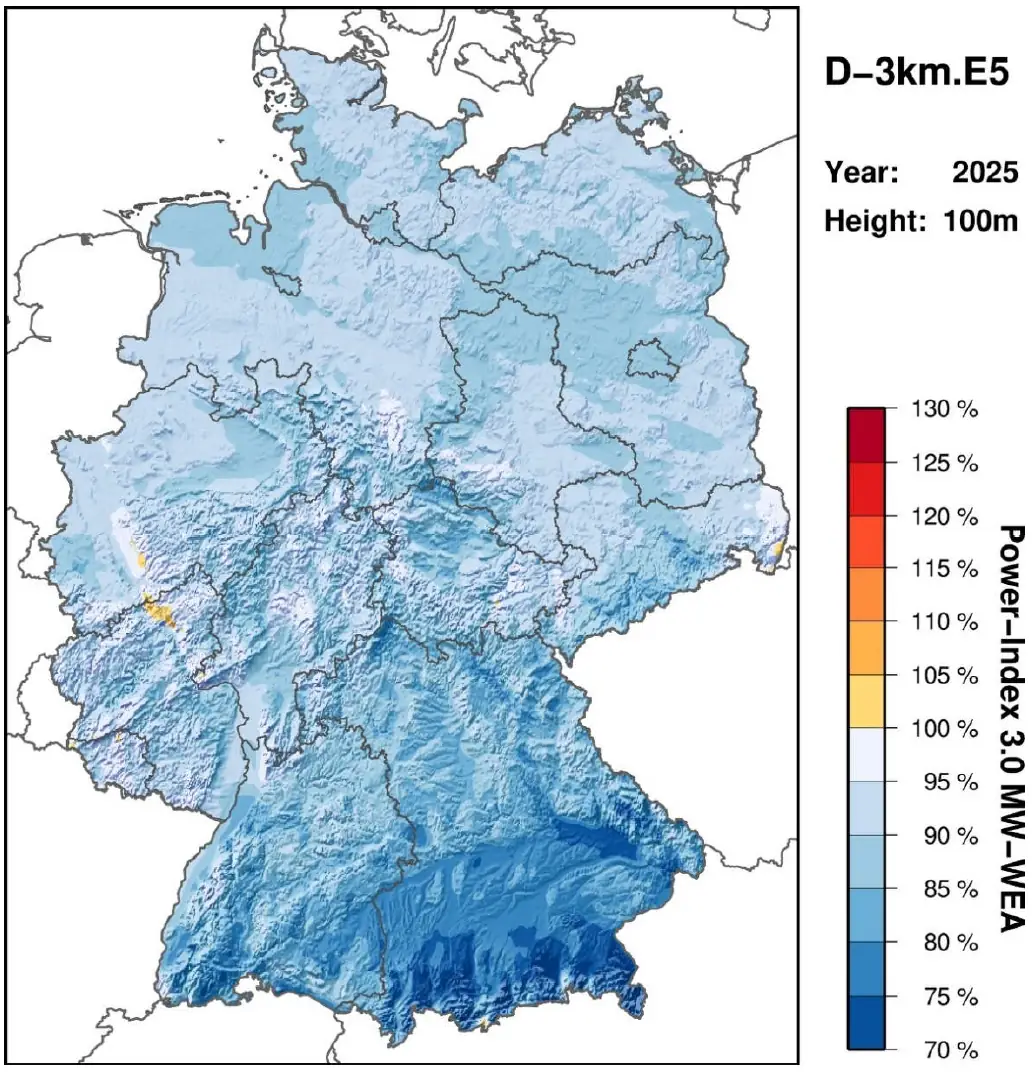
An energy yield index is an essential tool for operators, operational managers or asset managers of wind farms. Fluctuations of the wind resource result in the fact that individual monthly energy yields often differ a lot from the long-term average. Thus, it is important to ensure that the monthly variations of energy yield coincide with the variations of the wind resource. Through the use of external data like the energy yield index, it is possible to figure out, whether a wind farm is below expectations due to low wind speed or due to technical issues. In addition, the index enables a simple long-term correction after a few months of operation already. More detailed application examples can be found here (German).
The anemos energy yield index is based on our wind atlases. Time series of wind speed and air density are combined with power curves to provide temporally high resolved energy yield time series. Afterwards, monthly energy yields are divided by the 100% level and result in a monthly energy yield index. The 100 % level is defined as the mean energy yield of the last 20 years. This index refers to the gross energy yield without losses and consequently, it is an indicator for the wind potential and the gross energy yield potential.
By default, you receive our energy yield index for eight typical wind turbine types. Gladly, we generate a site- and turbine-specific index with your individual WTG types and hub heights.
The anemos energy yield index is an essential supplement or alternative to the BDB-Index (IWET-Index) which was widely used in Germany for many years. Although there are problems occurring by the use of the BDB-Index, it is still applied in many cases.
More information about the BDB-Index is available in the following papers (German):
"IWET / BDB Ertragsindex - quo vadis ?" (01.05.2015) and "Immer noch IWET?" (15.05.2017).
 This product is available in our webtool awis
Production atlas
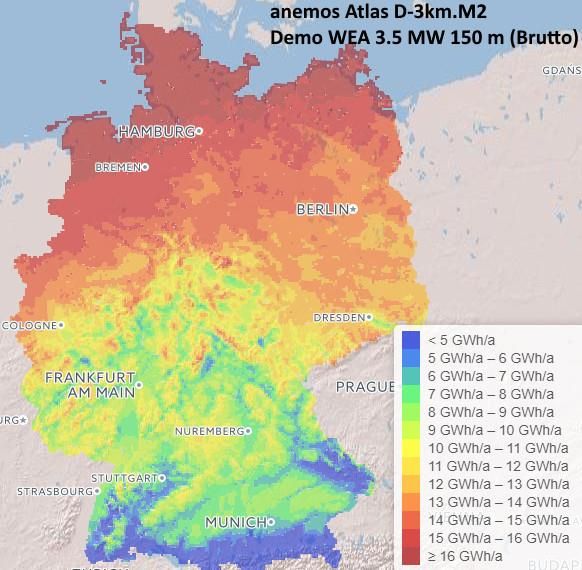
Do you need a quick estimate of energy yield for diverse specific wind turbine generators? Our anemos production atlas calculates the energy yields with your given power curves and hub heights.
Therefore, the production atlas allows a comparison between different WTG technologies. Plus, it is a tool for selecting a suitable wind farm site or for expanding your portfolio.
Gladly, we generate wind farm specific production time series for you which consider your given wind farm configuration and losses.
You receive the production data either as site-specific* time series or as map(s) of the mean energy yield of the last 20 years; available with 90 m x 90 m resolution (for Germany and France)
This product is available in our webtool awis
Maps
Our maps of different parameters assist you with the choice of the site, the selection of an adequate WTG type and with a first evaluation of the site quality.
The following maps are currently on offer.
-
25m x 25m maps for Germany and France with:
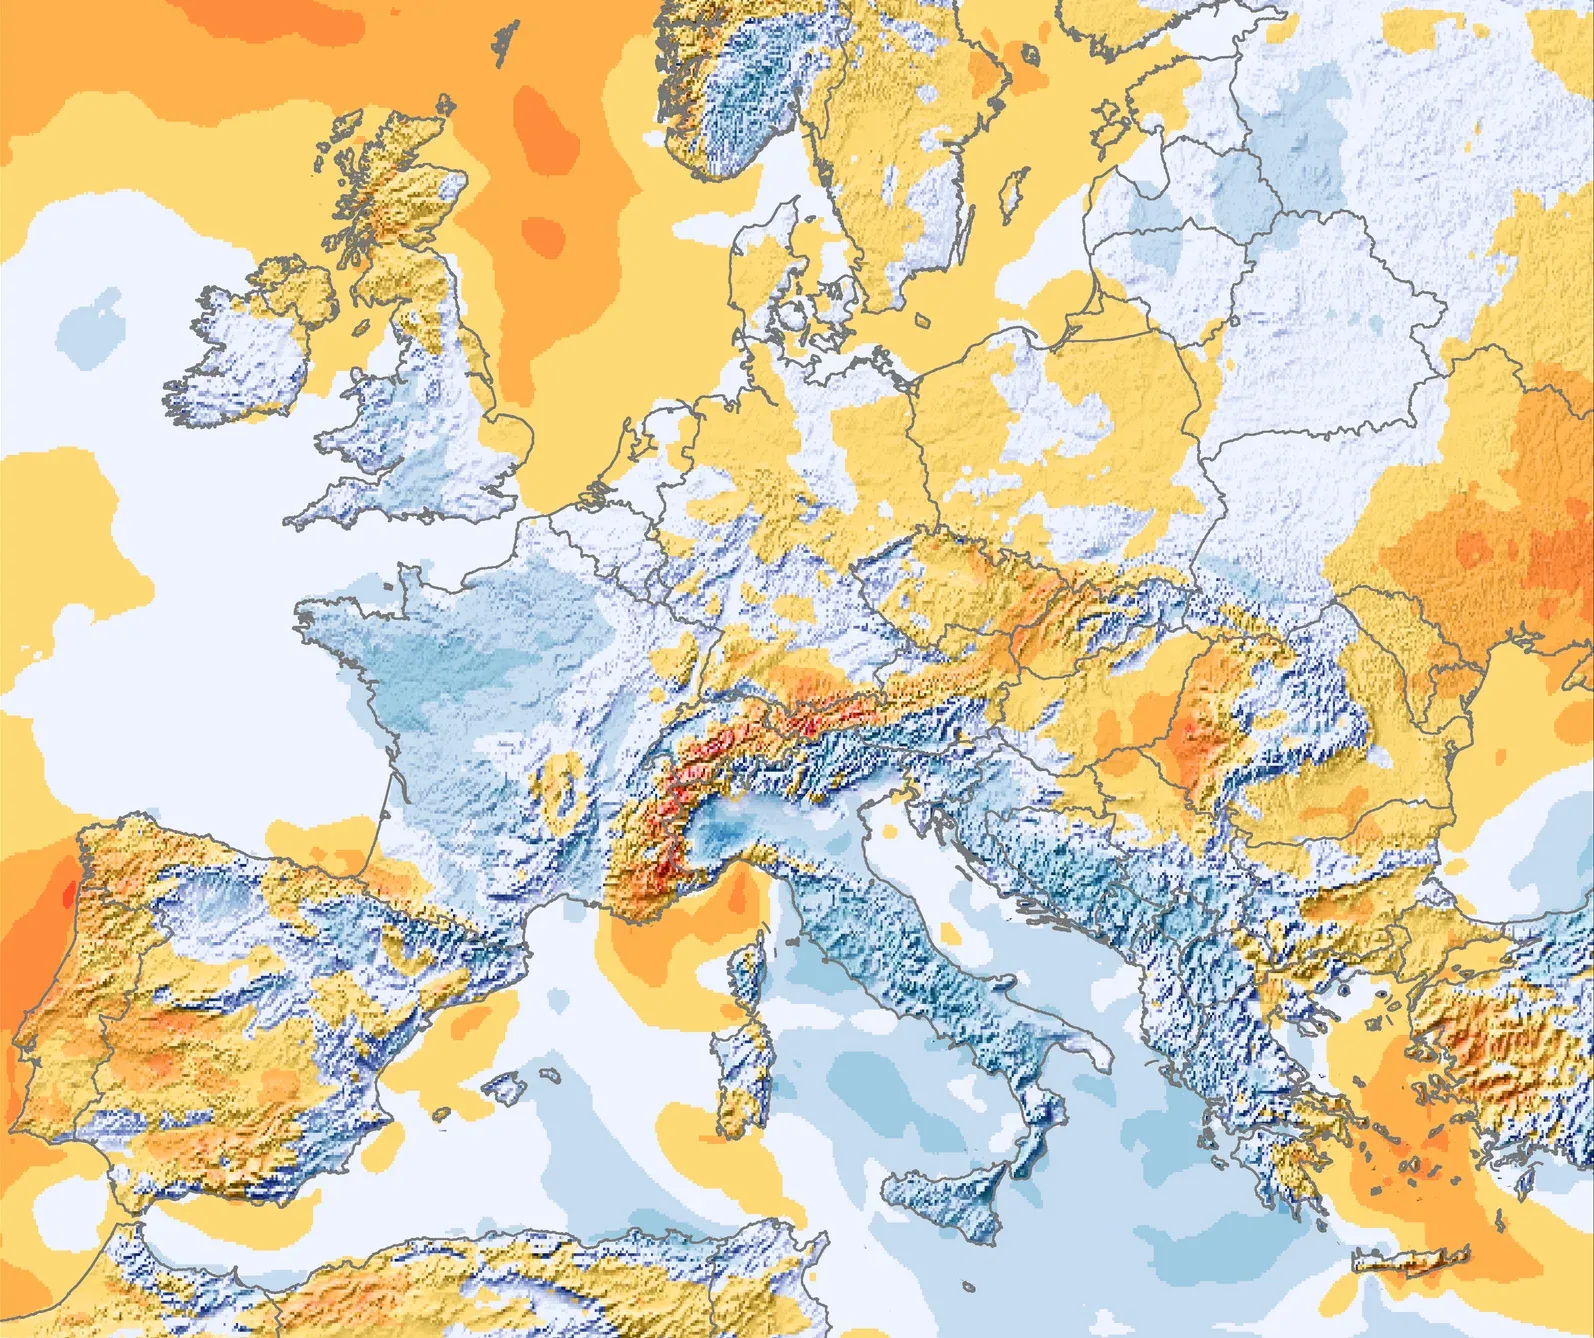
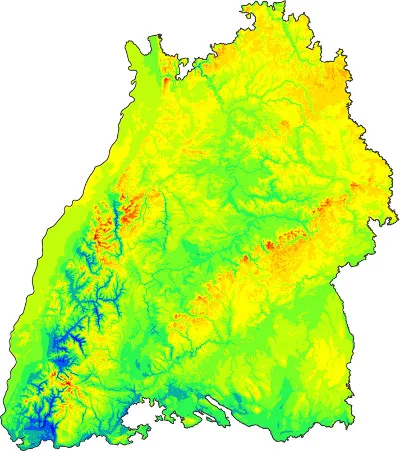
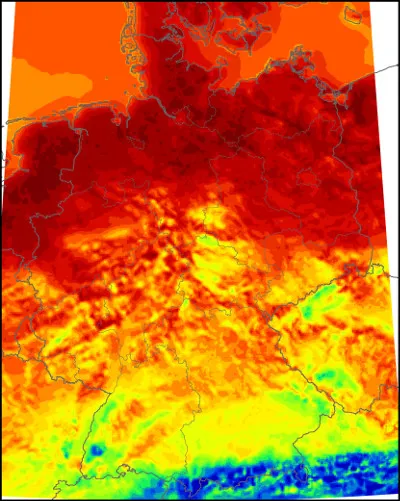
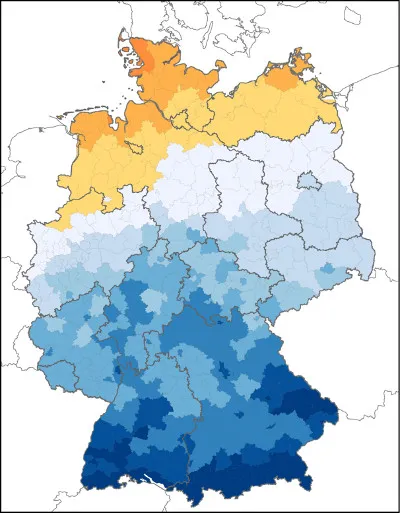
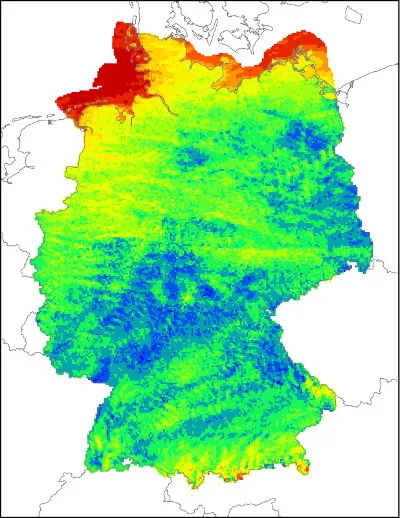
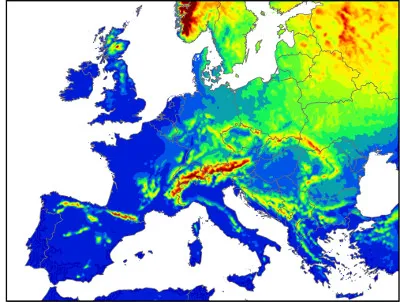
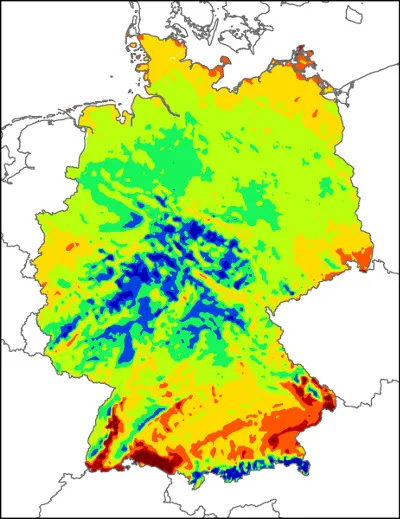
On request, we are happy to generate maps adjusted to your needs.
The maps are available in different formats: jpg, ESRI Shape, Google Earth KML or online. Together we determine the appropriate format for your purpose.
This product is available in our webtool awis
awis energy yield calculation
We determine an initial estimation of the energy yield for your planned wind farm. The following analysis can be done with the product:
- Comparison of energy yields of planned turbines with different configurations of type, hub height or coordinates
- Guide value as a first estimate
- Relative comparison of different sites with planned turbines with the same configuration
- Energy yield drop due to building of additional turbines
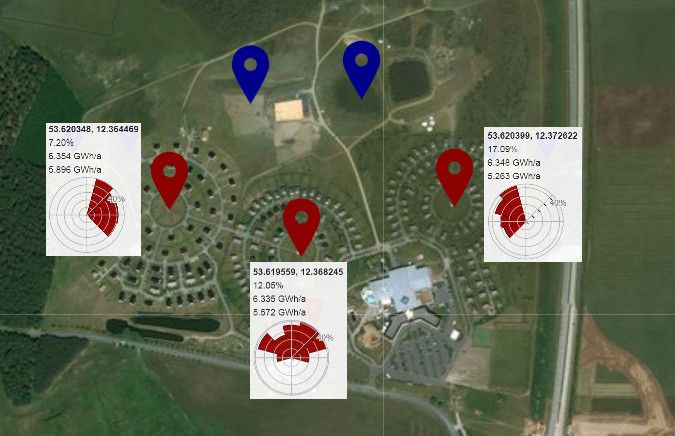
Additionally, the product awis energy yield calculation is excellent for the calculation of wake losses due to surrounding wind turbines. The product is especially suitable for:
- Wake losses of planned turbines in an existing wind farm
- Wake losses of a planned wind farm
- Future wake losses of existing turbines due to planned turbines
- Comparison between the wake losses of different configurations
On request we consider e.g. further restrictions or an adaption to measurements or energy yield data, respectively.
Do you need an expert opinion, e.g. because our experts should take a closer look at the site or make adjustments, or a signed report? Then the initial estimation based on wind atlases is the right choice for you.
This product is available in our webtool awis
Your contact persons

Martin Schneider
Managing director
Tel.: +49 (0)4131 8308 - 0
martin.schneider@anemos.de

Ignacio Martin Santos
M.Sc. Meteorology
Tel.: +49 (0)4131 8308 - 107
ignacio.martin-santos@anemos.de

Philine Podein
M.Sc. Meteorology
Tel.: +49 (0)4131 8308 - 144
philine.podein@anemos.de

Max Weißenborn
M.Sc. Environmental Sciences
Tel.: +49 (0)4131 8308 - 126
max.weissenborn@anemos.de
Your contacts
-

Lasse Blanke
Managing director
Tel.: +49 (0)4131 8308 - 0
lasse.blanke@anemos.de -

Julia Blanke
Dipl. Meteorologist
Tel.: +49 (0)4131 8308 - 120
julia.blanke@anemos.de -

André Glücksmann
Head of IT / Operational Site Quality
Tel.: +49 (0)4131 8308 - 0
andre.gluecksmann@anemos.de -
Martin Schneider
Managing director
Tel.: +49 (0)4131 8308 - 0
martin.schneider@anemos.de -

Krischan Lingel
M.Sc. Environmental engineering
Tel.: +49 (0)4131 8308 - 114
krischan.lingel@anemos.de -

Andree Nather
M.Sc. Meteorology
Tel.: +49 (0)4131 8308 - 113
andree.nather@anemos.de -

Dr. Gabriel Wolf
Dipl. Meteorologist
Tel.: +49 (0)4131 8308 - 106
gabriel.wolf@anemos.de -

Julian Ohl
M.Sc. Environment and Natural Resources
Tel.: +49 (0)4131 8308 - 104
julian.ohl@anemos.de -
Ignacio Martin Santos
M.Sc. Meteorology
Tel.: +49 (0)4131 8308 - 107
ignacio.martin-santos@anemos.de -

Niklas Bauer
B.Sc. Agricultural Science
Tel.: +49 (0)4131 8308 - 116
niklas.bauer@anemos.de -

Dr. Franziska Leverenz
M.Sc. Ocean and Climate Physics
Tel.: +49 (0)4131 8308 - 122
franziska.leverenz@anemos.de -

Dr. Claire Siddiqui
M.Sc. Physical Geography
Tel.: +49 (0)4131 8308 - 123
claire.siddiqui@anemos.de -

Thorben Busch
M.Sc. Meteorology
Tel.: +49 (0)4131 8308 - 117
thorben.busch@anemos.de -

Anna Lensch
M.Sc. Meteorology
Tel.: +49 (0)4131 8308 - 115
anna.lensch@anemos.de -
Philine Podein
M.Sc. Meteorology
Tel.: +49 (0)4131 8308 - 144
philine.podein@anemos.de -
Max Weißenborn
M.Sc. Environmental Sciences
Tel.: +49 (0)4131 8308 - 126
max.weissenborn@anemos.de -

Dr. Anna Siems
M.Sc. Marine environmental sciences
Tel.: +49 (0)4131 8308 - 135
anna.siems@anemos.de -

Regina Keller
M.Sc. Climate Physics: Meteorology and Physical Oceanography
Tel.: +49 (0)4131 8308 - 148
regina.keller@anemos.de -

Dr. Ing. Alexander Clement
M.Sc. Biomedical Engineering
Tel.: +49 (0)4131 8308 - 150
alexander.clement@anemos.de -
anemos head office
General enquiries
Tel.: +49 4131 8308 - 0
kontakt@anemos.de